Skip to content
You just read a headline that seems too outrageous to be true. A colleague shares a different article calling the first one propaganda. Both claim to report facts. Who is right?
- Visual map ranks news outlets by political bias on the X axis and reporting reliability on the Y axis for quick trust assessment.
- Ad Fontes uses three-analyst panels evaluating veracity, expression, and political position to produce balanced, reproducible reliability and bias scores.
- Use the chart daily: prefer top-center sources, cross-check sensational claims with high-reliability outlets, and audit your media diet regularly.
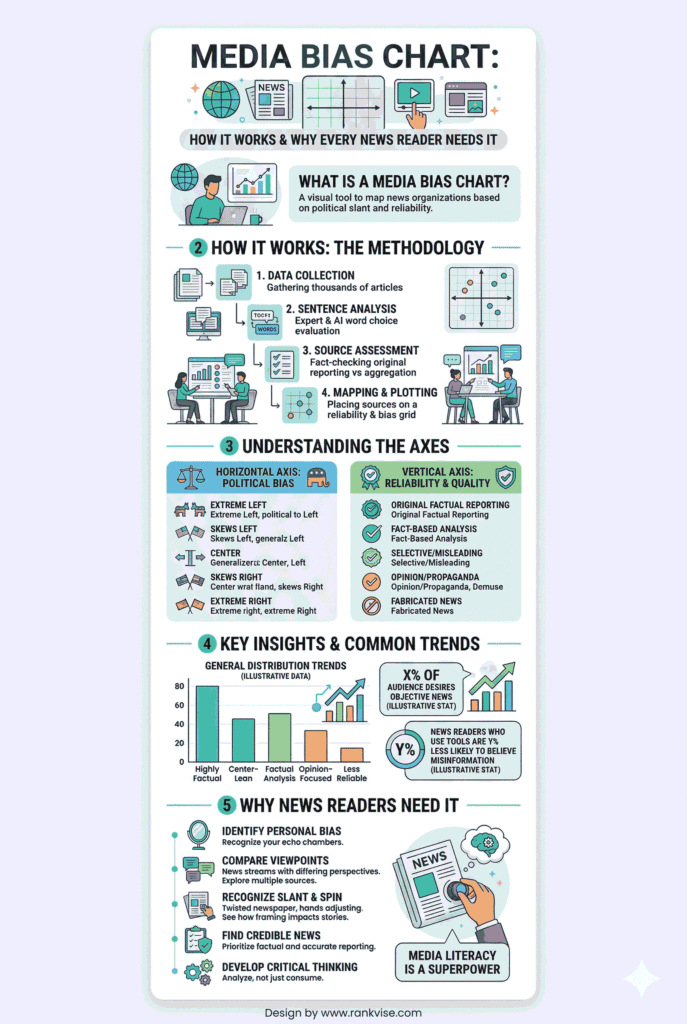
This is the exact problem the media bias chart was built to solve. It takes hundreds of news sources and places them on a visual map based on two things: how politically biased they are and how reliable their reporting is. Instead of guessing which outlets to trust, you can see the answer on a single grid.
Whether you run a business, teach a class, or simply want to make better-informed decisions, this guide breaks down how the media bias chart works, which sources rank highest, and how to apply it in your daily life.
What Is a Media Bias Chart?
A media bias chart is a data visualization that ranks news outlets on two dimensions. The horizontal axis measures political bias, from far left to far right. The vertical axis measures reliability, from original fact reporting at the top down to fabricated content at the bottom.
The most widely referenced version is the Ad Fontes media bias chart, created by patent attorney and media analyst Vanessa Otero. Ad Fontes Media uses a structured, reproducible methodology that sets it apart from casual opinion-based rankings.
The name “Ad Fontes” comes from the Latin phrase meaning “to the source.” That mission drives the entire project: helping readers trace information back to trustworthy origins rather than accepting spin at face value.
How the Ad Fontes Media Bias Chart Methodology Works
Ad Fontes does not rely on a single reviewer. Every piece of content is rated by a panel of three trained analysts. One identifies as politically left, one as center, and one as right. This balanced structure reduces the chance that any one perspective skews the score.
The analysts evaluate each article or broadcast segment on three specific criteria:
- Veracity measures factual accuracy. Does the content contain verified claims, or does it rely on unsupported assertions?
- Expression measures the degree of opinion. Is the language neutral and descriptive, or emotional and persuasive?
- Political position measures directional lean. Does the framing favor progressive or conservative viewpoints?
Ad Fontes has rated over 4,000 individual sources. The interactive version of the chart updates continuously as analysts review new content, while flagship static versions are released twice a year.
Understanding the Two Axes on the Bias Chart
Reading the media bias chart correctly requires understanding both dimensions at the same time. A source can be politically centered but unreliable. Another source can lean left or right but still report verified facts.
The X-Axis: Political Bias
The horizontal scale runs from -42 on the far left to +42 on the far right. Sources near zero sit in the political center. The further a source sits from zero, the more its framing favors one political perspective.
A slight lean does not automatically mean a source is untrustworthy. It means the language, story selection, or framing tends to favor one worldview. Extreme positions on either end, however, often correlate with lower reliability scores.
The Y-Axis: News Source Reliability
The vertical scale runs from 0 at the bottom to 64 at the top. Sources scoring above 40 deliver original fact reporting with minimal opinion. Those between 24 and 40 blend analysis with reporting. Anything below 24 contains misleading claims, propaganda, or outright fabrication.
| Reliability Tier | Score Range | What It Means |
|---|---|---|
| Fact Reporting | 40–64 | Verified, original reporting with minimal opinion |
| Analysis / Opinion | 24–40 | Factual foundation but subjective framing |
| Problematic | 0–24 | Misleading, sensational, or fabricated content |
The most valuable sources sit in the top center of the chart. Ad Fontes calls this area the “green box,” and it represents the gold standard for daily news consumption.
Which News Sources Rank Highest for Reliability?
Certain outlets consistently appear in the top-center zone of the news bias chart. These sources prioritize verified reporting over opinion and cover stories from multiple angles.
| News Source | Reliability Score | Bias Score | Category |
|---|---|---|---|
| Associated Press (AP) | 50+ | Near 0 | Neutral, Fact Reporting |
| Reuters | 50+ | Near 0 | Neutral, Fact Reporting |
| PBS NewsHour | 45+ | Slight Left | Reliable, Balanced |
| NPR (News Reporting) | 43.09 | -4.32 | Reliable, Skews Slightly Left |
| Wall Street Journal (News) | 44+ | Slight Right | Reliable, Balanced |
NPR is one of the most frequently searched outlets on the media bias chart. Its reliability score of 43.09 places it firmly in the fact-reporting zone, while its bias score of -4.32 indicates a very slight left-of-center lean. The opinion and news sections are rated separately, which is an important distinction.
News Sources with Notable Political Lean
Having a political lean does not make a source useless. It means readers should recognize the framing and cross-reference claims with neutral sources. The political bias chart becomes most valuable when it reveals the gap between a source’s perceived neutrality and its actual position.
- Left-leaning examples include MSNBC and Jacobin. Their prime-time and editorial content scores further left, often blending opinion with reporting.
- Right-leaning examples include Fox News (opinion programming) and The Daily Wire. These outlets frame stories through a conservative lens, especially in commentary segments.
The key takeaway is that extreme bias on either side tends to correlate with lower reliability scores. Outlets near the edges of the chart are more likely to use emotional language, omit context, or present opinions as established facts.
How to Use the Media Bias Chart in Your Daily Routine
Knowing the chart exists is one thing. Applying it consistently changes how you consume information. Here are four practical steps.
Start in the green box. Make sources from the top center of the chart your primary news diet. Aim for 60 to 70 percent of your reading to come from this zone. AP, Reuters, and PBS NewsHour are reliable anchors.
Read laterally, not just deeply. When a story from a lower-ranked source grabs your attention, search for the same story on a high-reliability outlet. If no credible source is covering it, treat the original claim with skepticism.
Audit your own media diet. List the five news sources you visit most often. Look up each one on the interactive version of the Ad Fontes media bias chart. If all five cluster on one side of the political spectrum, you are likely inside a filter bubble.
Download the PDF for quick reference. Ad Fontes publishes a free static version of the chart on their website. Keep it bookmarked or printed near your desk for moments when a questionable headline lands in your inbox.
Ad Fontes vs. AllSides: Two Approaches to Measuring Bias
The Ad Fontes media bias chart is not the only tool available. AllSides offers a complementary perspective using a different methodology.
| Feature | Ad Fontes Media Bias Chart | AllSides Bias Chart |
|---|---|---|
| Methodology | Balanced analyst panels (Left, Center, Right) | Blind bias surveys and editorial review |
| What It Measures | Reliability and political bias | Political bias primarily |
| Visual Format | X-Y coordinate grid | Five-category scale (Left to Right) |
| Best Use Case | Checking if a story is factually sound | Understanding how different sides frame an issue |
Neither tool is perfect on its own. Using both gives you a more complete picture. Ad Fontes answers “Is this story reliable?” AllSides answers “How is this story framed compared to other perspectives?”
Why Businesses and Educators Rely on Media Literacy Tools
The media bias chart has moved well beyond casual readers. Communications teams at mid-size and enterprise companies use it to vet sources before sharing industry news internally. Sharing a low-reliability article in a company newsletter damages credibility.
Marketing professionals use it to assess the editorial standards of publications where they pitch stories or place advertisements. A placement in a high-reliability outlet carries more brand trust than one in a sensational clickbait site.
Educators at the high school and university level integrate the chart into media literacy curricula. It turns abstract concepts like “spin” and “framing” into something students can visually measure and discuss. The interactive version of the Ad Fontes chart allows students to search individual outlets and compare scores in real time.
Limitations You Should Know About
No single tool captures the full complexity of media. The media bias chart has three important limitations worth understanding.
First, it is a snapshot. Ratings reflect the content reviewed at a specific point in time. An outlet rated in early 2025 may have shifted its editorial approach by mid-2026. Legacy ratings do not automatically apply to current output.
Second, the analysts are human. Even with balanced panels, individual judgment plays a role. Ad Fontes mitigates this with its three-analyst pod structure, but no methodology eliminates subjectivity entirely.
Third, the chart rates outlets overall, not every individual article. A highly reliable source can still publish a poorly sourced opinion piece. The chart gives you a baseline, not a guarantee for every story.
What the Future Holds for the News Bias Chart in 2026
The media bias chart is evolving in three important directions. AI-assisted scoring, first introduced alongside human analysts in 2025, is accelerating the speed at which new content gets rated. This makes the 2026 version of the chart more dynamic and current than any previous edition.
Ad Fontes is also expanding coverage to include more podcasts, independent newsletters, and international outlets. This reflects how news consumption has shifted away from cable television toward decentralized digital media.
Industry-specific bias charts are also on the horizon. A dedicated chart for health news or technology reporting would help professionals in those fields identify misinformation faster. Expect niche versions to gain traction as demand for media literacy grows across sectors.
Conclusion
The media bias chart gives you something rare in today’s information landscape: a data-driven starting point for deciding what to trust. It does not tell you what to think. It shows you the track record of the sources trying to shape your thinking.
Build your media diet around the green box. Cross-reference claims across outlets. Audit your habits regularly. These small actions compound into a much sharper ability to separate fact from framing, and that skill is worth more than any single headline.
FAQs
AP and Reuters consistently score closest to the center with the highest reliability ratings. They are widely considered the most neutral, fact-driven sources on the chart.
Ad Fontes releases two major flagship versions per year, typically in January and August. The interactive online version updates continuously as analysts review new content.
Ad Fontes primarily rates national outlets, though coverage of local affiliates is expanding. For local stations, check whether they are rated individually or grouped under their parent network.
Yes. Ad Fontes publishes a free static PDF version on their official website for individual use. Licensed versions with higher resolution are available for educators and organizations.
Ad Fontes measures both reliability and political bias using analyst panels. AllSides focuses primarily on political bias using blind surveys. Using both tools together gives the most balanced assessment.