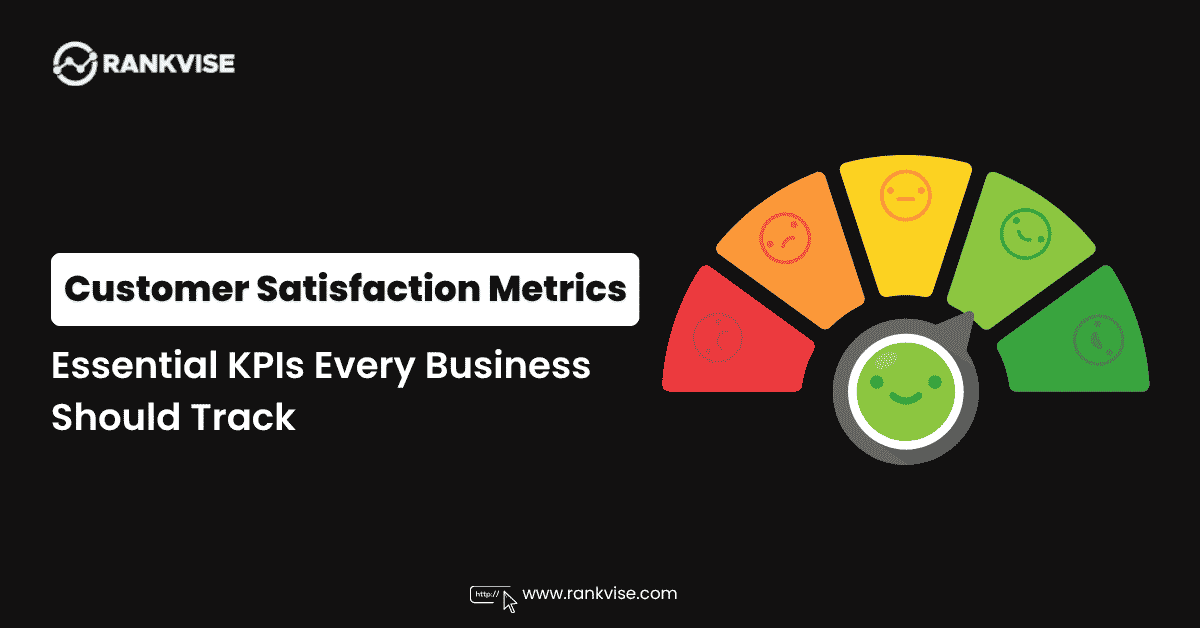
Measuring customer happiness isn’t optional anymore—it’s a growth strategy. Customer satisfaction metrics give you concrete data about how people experience your brand. Without tracking these numbers, you’re guessing instead of making informed decisions.
Businesses that consistently monitor satisfaction data retain more customers and earn stronger referrals. Research shows that increasing retention by just 5% boosts profits by 25–95%. The right metrics reveal exactly where your customer experience excels or needs improvement.
What Are Customer Satisfaction Metrics?
Customer satisfaction metrics are quantifiable measurements of how products or services meet buyer expectations. They capture sentiment at specific touchpoints across the entire customer journey. These indicators transform subjective feelings into actionable business intelligence.
Each metric serves a different purpose and answers a unique question about your experience quality. Some measure immediate reactions while others track long-term loyalty and advocacy. Together, they paint a complete picture of your customer relationship health.
The 7 Most Important Customer Satisfaction KPIs
1. Net Promoter Score (NPS)
NPS measures customer loyalty through one simple question: “How likely are you to recommend us?” Respondents score between 0 and 10, creating three categories—promoters, passives, and detractors. Subtract the detractor percentage from the promoter percentage to calculate your NPS.
A strong NPS typically falls between 30 and 70, depending on your industry. Track this metric quarterly to identify loyalty trends before they impact revenue. NPS predicts future growth more reliably than most other satisfaction indicators.
2. Customer Satisfaction Score (CSAT)
CSAT captures immediate satisfaction after specific interactions like purchases or support calls. Customers rate their experience on a scale, usually one through five. Calculate your score by dividing satisfied responses by total responses and multiplying by 100.
Deploy CSAT surveys at key touchpoints where experience quality directly affects retention. Keep surveys short—one or two questions maximum—to maintain high response rates. Benchmark your scores against industry averages to understand competitive positioning.
3. Customer Effort Score (CES)
CES measures how easy you make things for your customers. It asks: “How much effort did this interaction require?” Lower effort correlates strongly with higher loyalty and repeat purchases.
Companies reducing customer effort see 94% higher repurchase rates compared to high-effort experiences. Track CES after support interactions, onboarding flows, and checkout processes. This metric identifies friction points that frustrate customers before they churn.
4. Customer Churn Rate
Churn rate reveals the percentage of customers who stop doing business with you over time. Calculate it by dividing lost customers by total customers at the period’s start. Rising churn signals dissatisfaction that other metrics might miss.
Monitor churn monthly and segment by customer cohort, plan type, or acquisition channel. Pair churn data with exit surveys to understand why people leave. Reducing churn by even 1% delivers significant lifetime value improvements.
5. Customer Lifetime Value (CLV)
CLV estimates the total revenue a customer generates throughout their relationship with your brand. Satisfied customers produce dramatically higher lifetime values through repeat purchases and referrals. This metric connects satisfaction directly to financial outcomes.
Calculate CLV by multiplying average purchase value by purchase frequency and customer lifespan. Compare CLV across segments to identify which customers deserve the most attention. Growing CLV indicates your satisfaction efforts are translating into real revenue.
6. First Response Time and Resolution Time
Speed matters enormously in customer satisfaction measurement. First response time tracks how quickly your team acknowledges customer inquiries. Resolution time measures how long complete problem-solving takes from start to finish.
Customers expect responses within one hour for email and under two minutes for live chat. Track both metrics across every support channel to identify bottlenecks. Faster resolution directly correlates with higher CSAT and NPS scores.
7. Customer Retention Rate
Retention rate measures the percentage of customers who continue buying over a defined period. High retention signals strong satisfaction while declining rates warn of emerging experience problems. This metric directly impacts profitability and sustainable growth.
Calculate retention by subtracting new customers from end-of-period totals, then dividing by starting customers. Industry benchmarks vary—SaaS companies target 90%+ while retail averages around 63%. Improving retention always costs less than acquiring replacement customers.
How to Choose the Right Metrics for Your Business
Not every metric suits every organization equally. Your selection depends on business model, customer journey complexity, and strategic priorities. Start with two or three core metrics before expanding your measurement framework.
Consider these factors when choosing metrics:
- Business model type (subscription vs. transactional)
- Customer journey length and complexity
- Available resources for survey deployment and analysis
- Strategic goals (growth, retention, or experience improvement)
- Industry benchmarks and competitive context
Best Practices for Tracking Customer Satisfaction
Collect Feedback at the Right Moments
Timing determines response quality more than question design. Survey customers immediately after meaningful interactions while emotions remain fresh. Avoid surveying during frustrating moments like billing issues unless measuring resolution effectiveness.
Combine Quantitative and Qualitative Data
Numbers reveal what’s happening; open-ended responses explain why. Always include one optional text field alongside your rating scales. Qualitative insights guide improvement initiatives that raw scores alone cannot direct.
Act on Findings Quickly
Collecting data without action destroys customer trust faster than not asking at all. Create closed-loop processes that route negative feedback to appropriate teams within 24 hours. Customers who see their feedback driving changes become your strongest advocates.
Benchmark and Track Trends Over Time
Individual scores matter less than directional trends across months and quarters. Establish baselines before implementing changes so you can measure actual impact. Compare against industry standards to understand your relative performance position.
Common Mistakes When Measuring Customer Satisfaction
Many businesses collect satisfaction data but fail to extract meaningful insights. Over-surveying fatigues customers and tanks response rates below statistical significance. Asking biased questions produces artificially inflated scores that mask real problems.
Another frequent error involves measuring satisfaction without connecting it to business outcomes. Satisfaction metrics gain executive support only when linked to revenue, retention, and growth. Always present findings alongside their financial implications to drive organizational action.
Tools for Measuring Customer Satisfaction Metrics
Effective measurement requires the right technology stack. Survey platforms like Typeform, SurveyMonkey, and Qualtrics simplify feedback collection across channels. Customer experience platforms such as Medallia and Zendesk consolidate metrics into unified dashboards.
Choose tools that integrate with your existing CRM and support systems. Automated triggers deploy surveys at optimal touchpoints without manual intervention. Analytics capabilities should include segmentation, trend visualization, and predictive modeling.
FAQs
NPS is widely considered the most valuable single metric because it predicts future growth and correlates strongly with customer loyalty and revenue outcomes.
Measure CSAT after each interaction, track NPS quarterly, and review churn and retention monthly to maintain a comprehensive view of customer experience health.
A CSAT score above 75% is generally considered good, while scores above 85% indicate excellent performance across most industries.
They identify dissatisfied customers early, enabling proactive outreach and problem resolution before frustration escalates to cancellation decisions.
Yes—small businesses can start with free survey tools and manual tracking of NPS and CSAT to gain actionable insights without significant technology investment.